Monitoring the SRE Four Golden Signals

In the world of Site Reliability Engineering (SRE), monitoring plays a crucial role in maintaining the reliability and availability of systems. Google’s SRE team introduced the concept of “Four Golden Signals” to effectively monitor and assess the health of services. These signals are essential metrics that provide valuable insights into the system’s performance and help SREs in identifying and resolving issues proactively. In this blog post, we’ll delve into the details of the SRE 4 Golden Signals, their significance, and how to monitor them effectively.
What are the SRE 4 Golden Signals?
The SRE 4 Golden Signals consist of four key metrics that provide a well-rounded view of service health. These signals are:
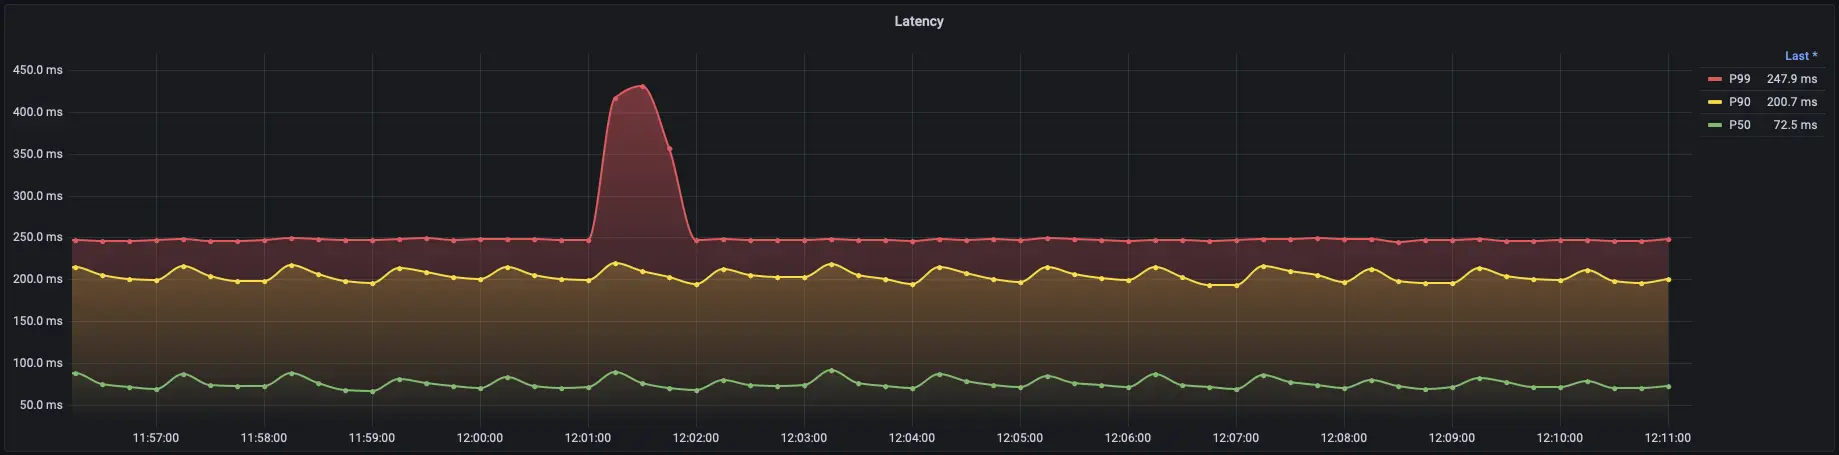
1. Latency
This metric measures the time taken for a request to be processed from start to finish. It indicates how responsive the service is to incoming requests. Latency can be critical for user satisfaction and is typically measured in milliseconds.
2. Errors
The error rate represents the proportion of requests that result in errors or failures. Monitoring this signal helps in identifying potential issues affecting the service and highlights areas that require improvement.
3. Traffic
This signal refers to the volume of requests or the amount of traffic that the service is handling. It gives an understanding of the load on the system and can help in capacity planning and resource allocation.
4. Saturation
Saturation indicates the utilization level of critical system resources, such as CPU, memory, or network bandwidth. High saturation levels can lead to performance degradation and service instability.
Importance of Monitoring the Golden Signals
Monitoring the SRE 4 Golden Signals is crucial for the following reasons:
Early Detection of Issues
By monitoring latency and error rates, SREs can quickly detect and address potential problems before they escalate. Proactive identification of anomalies helps in maintaining a high level of service reliability.
Performance Optimization
Analyzing traffic patterns and resource saturation allows SREs to optimize the system’s performance. Understanding the load and resource usage helps in fine-tuning the infrastructure to handle varying levels of demand efficiently.
Service-Level Objectives (SLOs) Compliance
SREs often define SLOs, which are specific targets for service performance. Monitoring the golden signals ensures that the service meets its SLOs, and if not, it aids in diagnosing the reasons and taking corrective measures.
Incident Response and Troubleshooting
During incidents or outages, the golden signals act as valuable diagnostic tools. They provide essential data to understand the root cause of the problem and help in identifying the scope and impact of the issue.
Latency Monitoring Strategies
Request Tracing
Implement distributed tracing to trace the journey of a request through various components of the system. This provides insights into the time spent at each step, helping identify bottlenecks.
Percentile Latency
While average latency can give a general idea of the system’s performance, it does not represent the complete picture. The distribution of latency values can vary widely, and certain requests may experience much higher latency than others. Percentile latency is a more robust approach to understanding the system’s responsiveness.
P50 (Median) Latency
The P50 (or median) latency represents the value below which 50% of the requests fall. In other words, it indicates the typical or median latency experienced by users. Monitoring P50 latency helps identify the majority of users’ experiences and provides a baseline for comparison against Service Level Indicators (SLIs).
P90 (90th Percentile) Latency
The P90 latency represents the value below which 90% of the requests fall. This metric gives insight into the performance experienced by most users, but it also considers the impact of a small fraction of requests that experience higher latency.
P99 (99th Percentile) Latency
The P99 latency represents the value below which 99% of the requests fall. It focuses on the tail end of the distribution, capturing the latency experienced by the vast majority of users while considering the outliers. This metric is particularly important because even though a small percentage of requests may experience significantly higher latency, it can still affect user experience and satisfaction.
SLIs (Service Level Indicators)
Define SLIs based on latency thresholds, such as “95% of requests should be served within 200ms.” Monitor these SLIs and trigger alerts if they breach the defined thresholds.
Error Monitoring Strategies
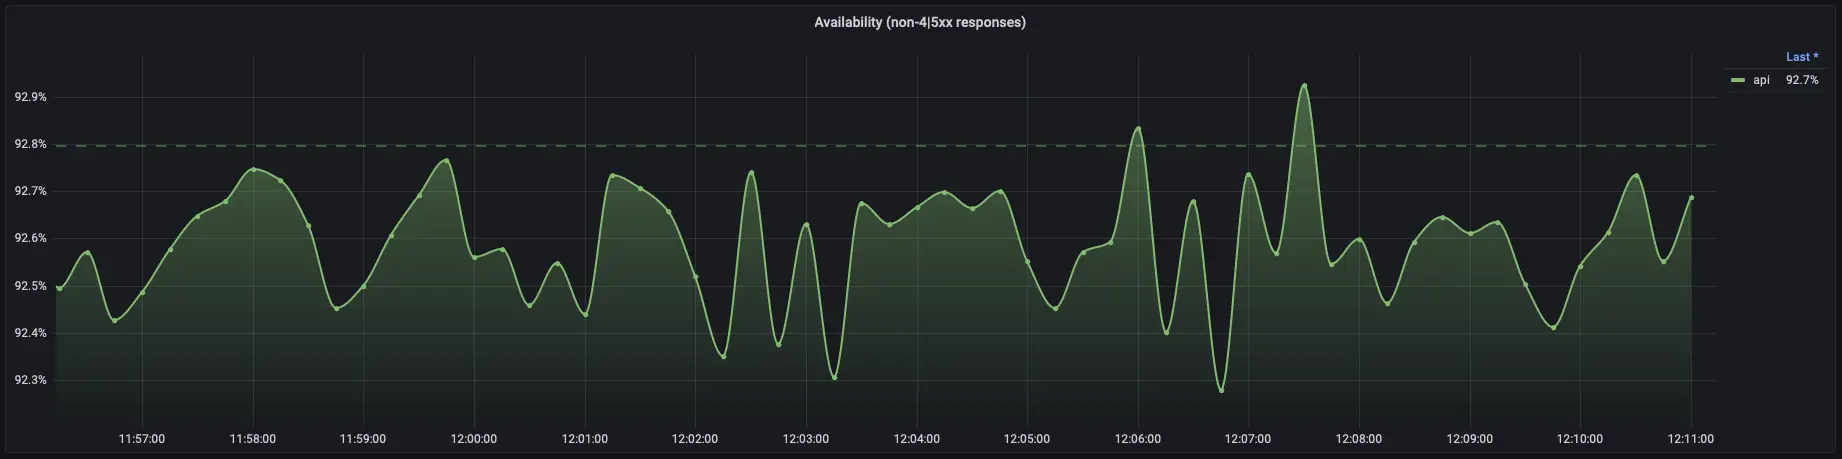
Error Rate Calculation
Track the number of requests resulting in errors and calculate the error rate as a percentage of total requests. Monitor this rate over time to detect spikes or unusual patterns.
Error Budgets
Set error budgets (acceptable level of errors) based on SLOs. Monitor error rates against these budgets to ensure that the service remains within acceptable limits.
Error Alerts
Configure alerts to notify SREs when error rates exceed predefined thresholds. This allows for timely intervention in case of issues.
Traffic Monitoring Strategies
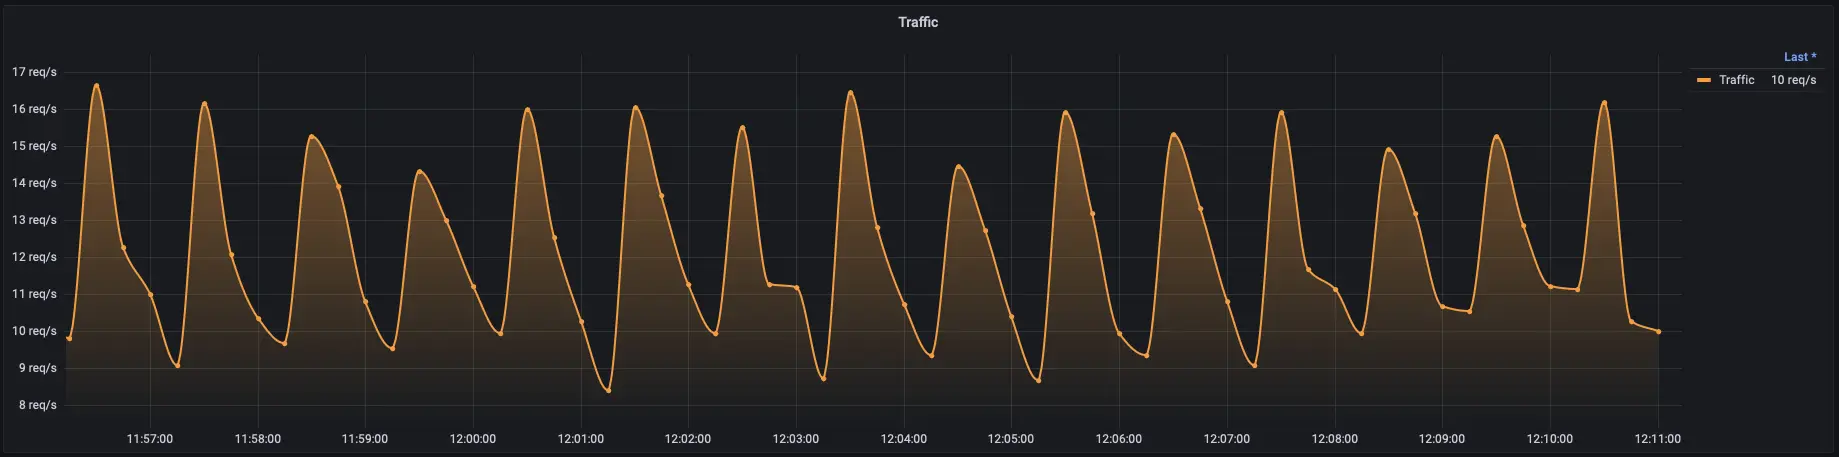
Request Counting
Count incoming requests over specific intervals (e.g., requests per second). This provides an overview of the service’s workload.
Load Balancer Metrics
If applicable, monitor load balancer metrics to understand how traffic is distributed across instances or regions.
Seasonality Analysis
Analyze historical traffic data to identify patterns, trends, and seasonality. This helps in capacity planning and handling anticipated spikes in traffic.
Saturation Monitoring Strategies
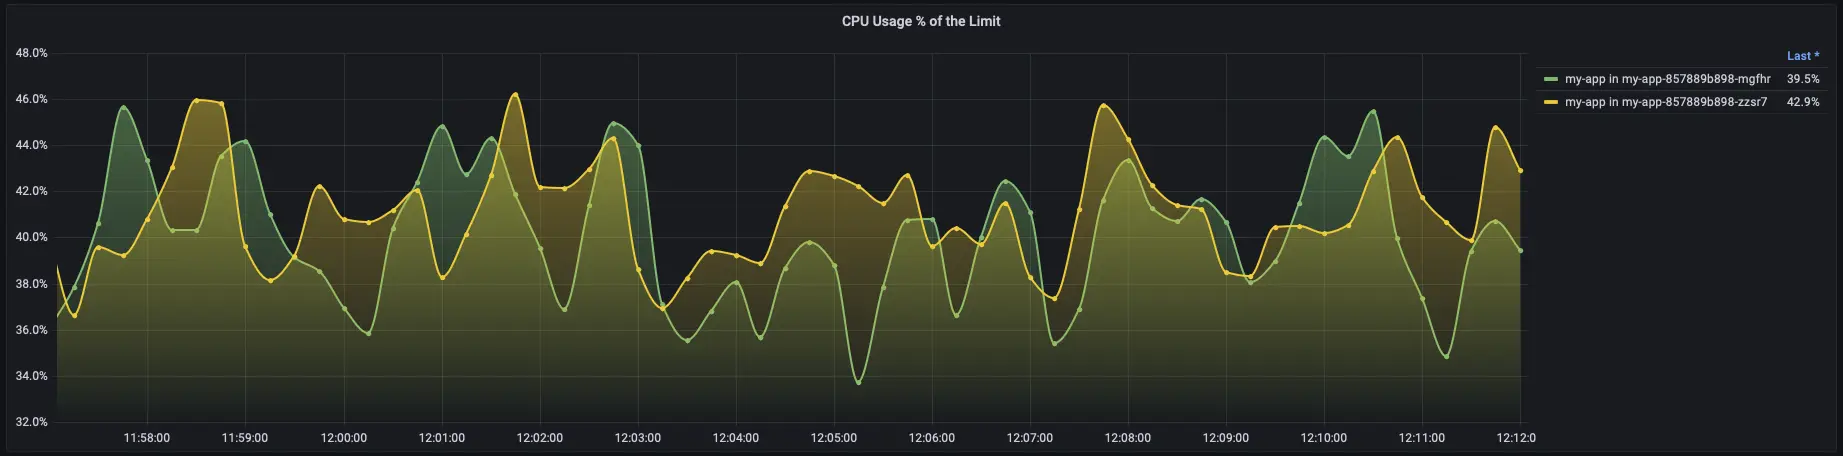
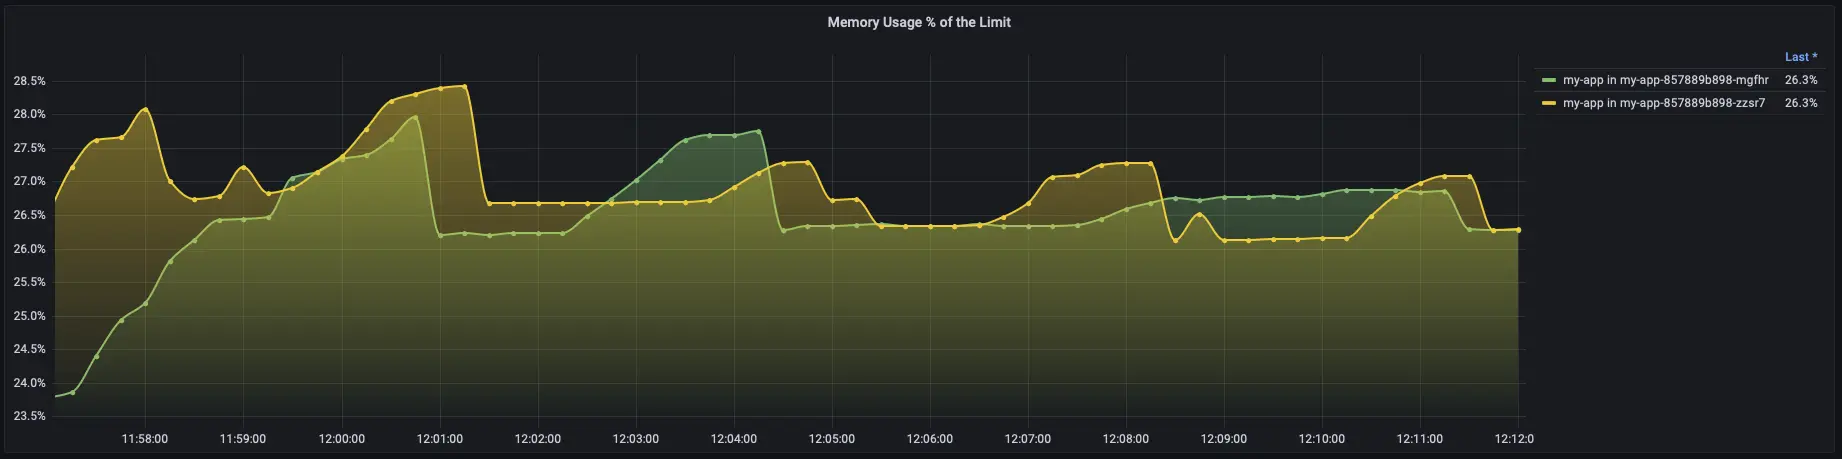
Resource Utilization Metrics
Collect and monitor key resource utilization metrics like CPU usage, memory usage, disk I/O, and network bandwidth.
Queue Lengths
If applicable, track queue lengths for critical components. Long queues may indicate resource saturation and potential performance issues.
Autoscaling
Implement autoscaling based on resource utilization metrics. Autoscaling ensures that resources are dynamically adjusted to meet varying demands.
Visualization and Alerting
Visualization and alerting are two of the most essential and fundamental aspects that play a paramount role in successfully monitoring and maintaining the SRE 4 Golden Signals, as they not only provide a comprehensive and easily digestible visual representation of the critical metrics encompassing latency, errors, traffic, and saturation, but they also ensure timely and proactive detection of any deviations or anomalies from predefined thresholds, empowering Site Reliability Engineering (SRE) teams to swiftly respond to potential incidents, make data-driven decisions, and implement necessary optimizations, ultimately safeguarding the overall reliability, availability, and performance of the services in question.
Visualization
Create intuitive dashboards and graphs to visualize the golden signals. Tools like Grafana, Kibana, or Datadog can be used to create real-time visualizations that enable SREs to quickly grasp the system’s health.
Alerting
Configure alerting rules based on the thresholds defined for each golden signal. Alerts should be timely, actionable, and sent to the relevant personnel through channels like email, Slack, or PagerDuty.
Conclusion
Monitoring the SRE 4 Golden Signals is fundamental to building and maintaining highly available, reliable, and performant services. By closely tracking latency, errors, traffic, and saturation, SREs can ensure that systems meet their performance goals and deliver a seamless user experience. Effective monitoring enables early detection of issues, optimized performance, and efficient incident response – all contributing to a robust and reliable service.